
MAKING AN EVALUATION
Corn Planting
Performance
By Greg Stewart, OMAFRA
Corn Specialist
Taking a close
look at your corn fields this spring for yield-limiting conditions
will help with future equipment and management decisions.
When assessing your corn planters (operator and machine) performance this year,
there are three specific things that you should look for: uniformity of plant
spacing, uniformity of plant emergence, and consistency in obtaining desired
final plant populations. Most of us appreciate the perfect picket fence field
of corn, but it's important to understand which elements of your corn plant
stand contribute the most to your cropping profitability.
Uniformity of
Spacing
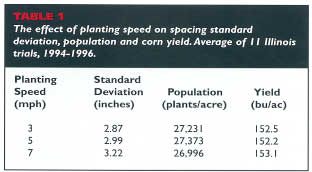
Corn plants that are perfectly spaced down the row would seem to have a much
better chance to optimize final yields. Equipment companies and agronomy researchers
have contributed to producing more uniformly spaced corn fields and to promoting
their necessity. Spacing uniformity can be measured by the occurrence of doubles
or skips, or in terms of standard deviation. An absolutely perfect stand where
every plant is exactly 7.25 inches, (28,840 plants per acre in 30-inch rows)
from its neighbour would have a standard deviation of zero. If plants on average
varied plus or minus two inches from the desired 7.25 inches then the standard
deviation would be two. Dr. Bob Nielsen (Purdue University, Indiana) has conducted
extensive investigations into the effects of plant spacing variability on final
yield. He calculates that every additional one inch of standard deviation decreases
yields by 2.5 bu/ac. When former University of Guelph professor Tony Vyn and
I started narrow-row corn research in 1995, we went at it with the idea that
plant-spacing uniformity might be less of an issue in 20-inch row corn due to
the increasing ability for neighbouring rows to compensate for gaps. This research
consisted of several different row widths, while imposing spacing uniformity
differences by hand thinning shortly after emergence. Interestingly, this research
has not shown any yield loss due to increased plant-spacing variability, regardless
of row widths.
 I
have been concerned that the thinning operation might have been skewing the
results by disturbing the neighbouring soil. So in 1999, we applied Roundup
herbicide (via bingo daubers) to the plants that needed to be removed from the
overplanted rows. The results were the same as in previous years: relatively
poor plant-spacing uniformity yielded the same as the most precisely spaced
plots. Earlier research at the University of Guelph by Vyn and Terry Daynard
also indicated that differences in plant-spacing uniformity had little effect
on final yields. Discrepancies between different research findings may have
something to do with hybrids, plant populations, or other factors that confound
spacing effects.
I
have been concerned that the thinning operation might have been skewing the
results by disturbing the neighbouring soil. So in 1999, we applied Roundup
herbicide (via bingo daubers) to the plants that needed to be removed from the
overplanted rows. The results were the same as in previous years: relatively
poor plant-spacing uniformity yielded the same as the most precisely spaced
plots. Earlier research at the University of Guelph by Vyn and Terry Daynard
also indicated that differences in plant-spacing uniformity had little effect
on final yields. Discrepancies between different research findings may have
something to do with hybrids, plant populations, or other factors that confound
spacing effects.
The point behind this discussion is not to encourage poor planter set-up, or
ignore unevenly spaced corn, but to underline the following points:
Uniformity of Emergence
Perhaps one of the most significant changes that you might consider making
when evaluating corn planter performance is in looking at the uniformity of
the plant emergence. Because it's almost impossible to find time to actually
monitor corn 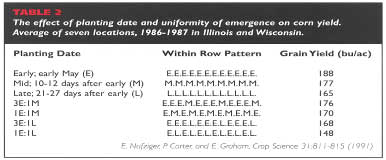 plants
as they emerge, you will need to examine corn plant leaf numbers to see if
the plants are all at the same stage of development. Some substantial research
both in Ontario and in the U.S. Corn Belt has indicated that when neighbouring
corn plants are not uniform in size yields will suffer. Dr. Emerson Nafziger
(University of Illinois) has reported corn yields based on plots which have
differences in uniformity of emergence (Table 2). These hand-planted plots
consisted of uniformly planted plots on three separate dates. They also included
various combinations of plots where certain fractions of the plants were planted
later to simulate delayed emergence. In Table 2 you notice the treatment labeled
3E:1M consisted of one plant in every four being planted 10 days later than
the neighbouring in-row plants. This resulted in a decrease in yield of 12
bushels (176 bu/ac) compared to the plots where all plants emerged uniformly
on the early planting date (188 bu/ac).
plants
as they emerge, you will need to examine corn plant leaf numbers to see if
the plants are all at the same stage of development. Some substantial research
both in Ontario and in the U.S. Corn Belt has indicated that when neighbouring
corn plants are not uniform in size yields will suffer. Dr. Emerson Nafziger
(University of Illinois) has reported corn yields based on plots which have
differences in uniformity of emergence (Table 2). These hand-planted plots
consisted of uniformly planted plots on three separate dates. They also included
various combinations of plots where certain fractions of the plants were planted
later to simulate delayed emergence. In Table 2 you notice the treatment labeled
3E:1M consisted of one plant in every four being planted 10 days later than
the neighbouring in-row plants. This resulted in a decrease in yield of 12
bushels (176 bu/ac) compared to the plots where all plants emerged uniformly
on the early planting date (188 bu/ac).
When you walk your corn fields, keep the following ideas in mind:
Plant Populations
The third element that should concern you is whether you actually have the
desired final plant stand. Measure off 17.5 feet of row (30-inch rows) and
count all the corn plants, multiply by 1,000 and you have the number of plants
per acre. In Ontario, final plant populations should probably be 26,000 -
32,000 plants per acre. If your planter is not falling somewhere in this range,
 identify
this as one of the first improvements to be made. If your plant stands are
low, is it because you are not allowing for a 5-10 per cent reduction from
seed drop to final stands? A recent research report published in the Agronomy
Journal (D. Bullock et. al., 1998) indicated that the optimum final plant
population in the midwest Corn Belt on average is 27,160 plants per acre.
These researchers also predicted that for every 15 bu/ac increase in a field’s
yield potential (or parts of fields), economically optimal populations increased
by 450 plants per acre. So in Ontario, while we may generally shoot for slightly
higher average final stands than in the midwest, you will also want to ensure
that your productive fields are near the upper end of the plant population
range. Fields that are traditionally lower yielding because of low water-holding
capacity, poor soil structure, etc., have economic optimal populations lower
in the range.
identify
this as one of the first improvements to be made. If your plant stands are
low, is it because you are not allowing for a 5-10 per cent reduction from
seed drop to final stands? A recent research report published in the Agronomy
Journal (D. Bullock et. al., 1998) indicated that the optimum final plant
population in the midwest Corn Belt on average is 27,160 plants per acre.
These researchers also predicted that for every 15 bu/ac increase in a field’s
yield potential (or parts of fields), economically optimal populations increased
by 450 plants per acre. So in Ontario, while we may generally shoot for slightly
higher average final stands than in the midwest, you will also want to ensure
that your productive fields are near the upper end of the plant population
range. Fields that are traditionally lower yielding because of low water-holding
capacity, poor soil structure, etc., have economic optimal populations lower
in the range.
Keep in mind the following other points:
So, when you are out enjoying your twilight stroll through your corn field this June, don't forget to take along your clip board, pencil, calculator and yard stick!